Learning IntentionsTo be able to create suitable charts and insert Titles, Axis & data labels
Success CriteriaCreate a chart to show a range of different senerios and use formatting techniques to improve the look & layout
|
Keywords
|
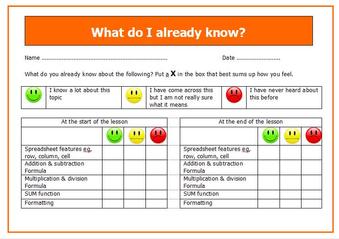
Learning Check
Complete the learning check to show your knowledge at the beginning of the lesson. We will come back to it at the end of the lesson and update it to show our progress.
TASK 1.
You need to finish making the improvements to Hurry's spreadsheet. Click on the correct button for your team and try to make as many improvements as you can in the 15 mins.
You need to finish making the improvements to Hurry's spreadsheet. Click on the correct button for your team and try to make as many improvements as you can in the 15 mins.
TASK 2.
It's the end of Hurry's first year at Blogworts. You need to help Hurry Plotter to work out how much it has cost him for all of his items. Hurry wants to be able to easily see which item cost him the most so you need to make some charts.
It's the end of Hurry's first year at Blogworts. You need to help Hurry Plotter to work out how much it has cost him for all of his items. Hurry wants to be able to easily see which item cost him the most so you need to make some charts.
How did you do?
Go back to your learning check and complete section 2. How much progress have you made? Could you do even better next time?
